

Introduction
When you have critical applications and business processes that rely on Azure resources (or if you've been working with Azure AI Foundry for a while), you know that understanding what's happening inside your applications is crucial. The Azure monitor service collects and aggregates metrics and logs from every component of your system.
In this post, I'll walk you through how to configure Application Insights to get proper monitoring and tracing for your Foundry workloads.
Enable Trace in Your Foundry Project
It is important to understand that Azure AI Foundry integrates with Azure Application Insights via OpenTelemetry. Since new resources don’t provision Application Insights automatically, here are the steps to ensure your integration is configurated correctly:
1) Go to the Foundry portal and navigate to your project.
2) On the side navigation bar, select "Tracing."
3) If an Application Insights resource isn't available or associated with your Azure AI foundry resource, then create a new instance.
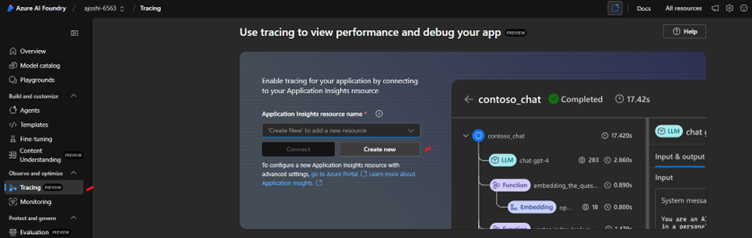
Note: Creating Application Insights resources here requires that you have at least "Contributor" permissions to the resource group. Please follow this resource link to setup tracing for Foundry-based applications.
Setting Up Tracing Using the Python SDK
1) Install packages
pip install azure-ai-projectsazure-monitor-opentelemetry opentelemetry-instrumentation-openai-v2
2) Get the connection string from the linked Application Insights resource
3) Use the following Python code:
from azure.ai.projectsimport AIProjectClient
from azure.identity importDefaultAzureCredential
fromazure.monitor.opentelemetry import configure_azure_monitor
fromopentelemetry.instrumentation.openai_v2 import OpenAIInstrumentor
project_client =AIProjectClient(
endpoint=os.environ["FOUNDRY_PROJECT_ENDPOINT"],
credential=DefaultAzureCredential(),
)
## add your App Insightconnection string here
connection_string ="InstrumentationKey=*******"
configure_azure_monitor(connection_string=connection_string)
AIInferenceInstrumentor().instrument()
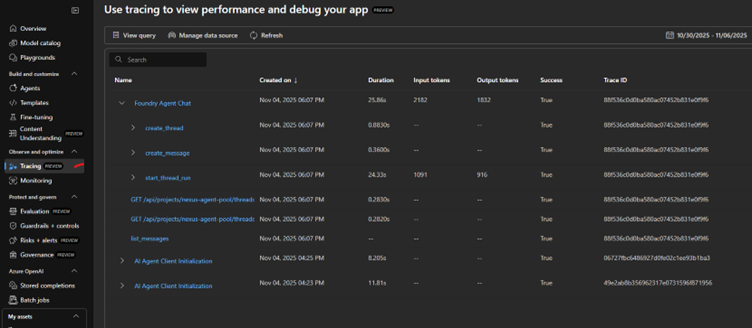
4) If you send any requests (i.e. creating an agent or chat completion), they will be captured under the "Tracing" section:
Monitoring Dashboard
Azure AI Foundry Observability integrates with Azure Monitor and Application Insights to surface real-time performance, usage, and evaluation metrics for Foundry applications. It provides both operational insights (like latency, errors, and throughput) and evaluation metrics (quality of model responses, safety indicators).
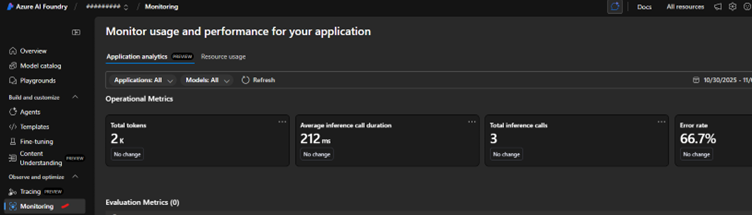
Monitoring Application Analytics
This tab (Application analytics) leverages Application Insights to display high-level model and app-level telemetry. Key metrics and categories include:
- Operational Metrics
- Latency / Response Time: Tracks end-to-end request latency via traces and dependencies.
- Error Rates & Exceptions: Captures exception counts and failure rates from instrumented telemetry.
- Throughput: Number of requests, AI completions, and user sessions.
- AI-Specific Metrics
- Token Usage: Counts of prompt, completion, total tokens (useful for cost optimization).
- Model Latency & Performance: Custom events/dependencies track model/API call durations.
- Evaluation Metrics:
- Model Quality & Safety: Continuous evaluation provides metrics like correctness, toxicity, bias, and safety violations integrated with agent traces.
- Operational Insights:
- Visual charts: Graphical trends in application performance, errors, latency spikes, throughput drops.
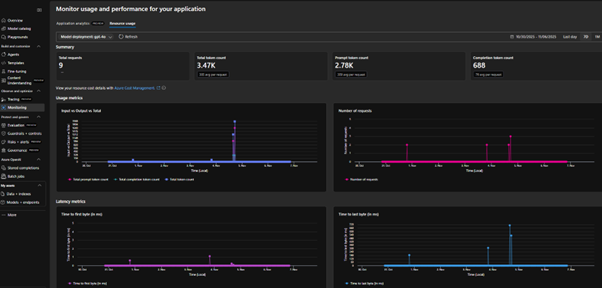
Monitoring Resource Usage
This focuses on underlying infrastructure utilization of the Foundry Agent Service using Azure Monitor platform metrics. This tab contains:
- Usage Metrics
- Latency Metrics
- Summary Metrics
- Input vs Output: Breakdown helps monitor prompt vs response volume.
- Total tokens: Reflects overall compute usage, directly linked to billing and capacity planning.
- Request count: shows throughput and workload patterns over time.
Conclusion
By following these various processes, you will also see some data on under the Monitoring Dashboard, where you can review details like Operational Metrics under Application analytics tab and resource level metrics under Resource usage Tab. We’ll cover more details for how to configure Evaluation metrics in next blog in this series.
Happy monitoring! 🚀
.svg)